
Accelerator expenses now rank among the largest infrastructure costs for most organizations. GPUs dominate as the priciest compute resource available, yet teams typically lack visibility into how they are being used. A single training cluster running for days can consume millions of dollars. To maximize utilization, most organizations share accelerators across teams on pooled clusters. However, platform teams operating these shared environments struggle to answer fundamental questions: which team consumes which accelerators? Does the inference workload generate tokens at an acceptable rate? Where is the budget leaking?
When a workload fails—whether from a faulty accelerator or thermal throttling—teams often discover the problem only when a run crashes or the bill arrives. The device-level telemetry required to diagnose the issue (request traces, kernel logs, memory metrics from the accelerator) typically goes uncollected or remains disconnected. Without the ability to pinpoint a problem to a single accelerator, teams resort to rebooting the entire instance, taking seven healthy GPUs offline to fix one, and frequently waiting for scarce capacity to return the instance to service.
GPUs have become the most expensive resource in modern computing, and yet most organizations operate them with little visibility.
Accelerator observability transforms these blind spots into actionable data. It reveals who is consuming accelerators, whether they remain healthy, and what inefficiency costs, down to individual devices. This enables teams to replace one faulty GPU instead of eight, and dedicate accelerator budgets to productive work rather than idle capacity.
Amazon CloudWatch accelerated compute insights, unveiled at KubeCon North America 2026, delivers a unified operational view across every accelerator in a fleet. It displays how GPU and AWS AI Accelerator capacity is consumed across Amazon Elastic Kubernetes Service (Amazon EKS) by platform and AI teams. This post examines what the capability delivers, its operation on Amazon EKS, and how to begin using it.
What accelerated compute insights does
Accelerated compute insights provides a unified operational view of every accelerator in a fleet. It tracks how each accelerator is being used, identifies failures and bottlenecks in real time, calculates the cost impact of each issue, and ties those findings to the actions needed to resolve them.
Accelerated compute insights holds accelerator telemetry, workload boundaries, and pricing data together, a combination that monitoring tools that only see metrics cannot replicate.
On Amazon EKS, the service supports NVIDIA GPUs, AWS Trainium, and AWS Inferentia. Metrics from NVIDIA GPUs and Inferentia are normalized into a common schema and displayed in a single Accelerator Health view, allowing teams managing mixed fleets to oversee every accelerator type from one location.
Fleet visibility with Kubernetes context
Each accelerator in an EKS cluster is augmented with Kubernetes metadata: pod, namespace, node, node group, and custom labels (team, application). Utilization becomes visible by team and workload across the entire fleet.
Accelerated Compute Insights automatically detects MIG (Multi-Instance GPU) partitioned GPUs and displays utilization and memory for each MIG instance alongside the pod consuming it. It also recognizes other partitioning approaches, including Kubernetes DRA (dynamic Resource allocation) and time-slicing, by reading device labels. Configuration is not required.
Cost waste identification
Accelerated compute insights merges real-time accelerator telemetry with workload boundary events and AWS pricing data to expose recoverable waste across three categories:
- Right-sizing opportunities: workloads running on more powerful instances than needed for the task.
- Training efficiency gaps: low tensor core (MFU) utilization relative to the workload's historical baseline, suggesting the job is not extracting full value from the hardware.
- Inference below hardware capacity: endpoints handling fewer requests than the hardware can support, based on customer-reported throughput correlated with device utilization.
For each finding, accelerated compute insights pinpoints the specific workload or node responsible, assisting users in troubleshooting and optimization. This capability exists because accelerated compute insights combines accelerator telemetry, workload boundaries, and pricing data—a combination that monitoring tools examining only metrics cannot achieve.
Note: CloudWatch accelerated compute insights is an operational tool, not a billing or chargeback tool. Cost figures are estimates intended to guide operational decisions. For authoritative cost and usage accounting, continue to use AWS Cost Explorer and the AWS Cost and Usage Report.
Device-level remediation
When an inference workload experiences performance degradation or inefficient token generation, accelerated compute insights helps identify GPU bottlenecks, inefficient accelerator utilization, and potential resource waste. By automatically gathering and correlating inference performance metrics, request traces, logs, and accelerator telemetry, it delivers end-to-end visibility into workload performance and GPU efficiency. With AI-powered insights and troubleshooting capabilities, customers can rapidly identify root causes, optimize token throughput, reduce inference latency, and improve accelerator utilization without affecting healthy workloads.
It distinguishes between failure modes that call for different actions. By default, the agent presents a specific, evidence-backed action plan for you to approve.
Health events can also be routed to the AWS DevOps Agent for extended investigation. The agent analyzes accelerator telemetry, CloudWatch logs, recent infrastructure changes, job configuration, and any runbooks in place. It distinguishes between failure modes requiring different actions. For instance, a node showing an accelerating memory-error trend that requires replacement differs from a driver issue that resolves with a restart. By default, the agent presents a specific, evidence-backed action plan for approval. For a faster resolution cycle, teams can authorize it to execute well-understood remediations through AWS APIs independently.
How it works on EKS
Collection paths converge at the CloudWatch Metrics API. For NVIDIA GPUs, the CloudWatch agent and NVIDIA Exporter gather device-level metrics. The Unified Accelerator Health Layer normalizes GPU and Inferentia collection paths into a common schema and displays them in a single dashboard.
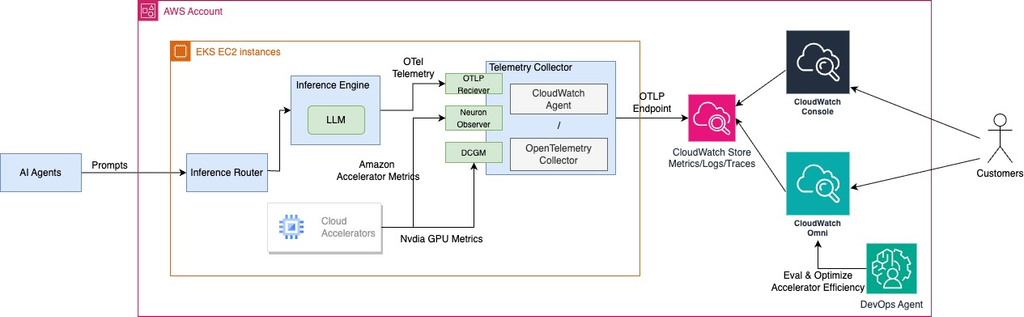
Amazon CloudWatch accelerated compute insights delivers end-to-end observability for AI inference workloads and accelerator efficiency on Amazon EKS through a multi-layered approach. Customers can deploy the CloudWatch Observability add-on from the CloudWatch console or CloudWatch Omni to gather NVIDIA GPU metrics and inference workload performance metrics, logs, and traces. The telemetry data flows into CloudWatch's centralized storage via the CloudWatch OpenTelemetry (OTLP) endpoint. Teams can monitor inference workload performance and GPU utilization directly in the CloudWatch console or use CloudWatch Omni and its AI-powered investigation to troubleshoot performance issues, identify accelerator inefficiencies, and optimize resource utilization.
Getting started on EKS
Deploy the CloudWatch Observability add-on with OTel Container Insights enabled. The add-on discovers accelerators and collects everything the dashboard requires. No per-node setup, no agents to manage, no collection pipelines to configure. The fleet appears in the console within minutes and stays current as nodes join and leave the cluster.
Step 1: Get your data flowing
For teams running self-hosted inference on Amazon EKS, install or upgrade the Amazon CloudWatch Observability EKS add-on to v7.0.1 or above. The add-on discovers every NVIDIA GPU and AWS Inferentia device in the cluster and begins sending OpenTelemetry data, with no per-node setup and no collection pipelines to configure.
The add-on can be enabled using eksctl, Helm, or Terraform. Examples using eksctl and Helm appear below:
Using eksctl
eksctl create addon \
  --name amazon-cloudwatch-observability \
  --cluster your-cluster-name \
  --region your-region
Using Helm
helm repo add aws-observability https://aws-observability.github.io/helm-charts
helm install amazon-cloudwatch-observability \
  aws-observability/amazon-cloudwatch-observability \
  --namespace amazon-cloudwatch --create-namespace
Step 2: Use your data in CloudWatch Omni
Once telemetry is flowing, launch CloudWatch Omni. Omni targets the teams that own the inference code and maintain it. Instead of a wall of infrastructure metrics, teams receive an application-centric view: inference workloads appear alongside the services and AI agents that call them, with accelerator health, utilization, and waste tied to each workload.
When an endpoint shows low throughput or high time to first token, Omni helps trace the problem to the workload, node, or single accelerator responsible and indicates what to change, whether a configuration update or a code fix. Teams can move from detection to fix without switching tools.
Instead of a wall of infrastructure metrics, you get an application-centric view: your inference workloads appear next to the services and AI agents that call them, with accelerator health, utilization, and waste tied to each workload.
Platform and infrastructure teams requiring a fleet-wide view, such as accelerator allocation across many teams, idle capacity, or a cross-account summary, can also access the same data on the accelerated compute insights page in the CloudWatch console.
Where this fits in the Amazon EKS observability stack
Amazon CloudWatch accelerated compute insights builds on the observability foundation shipped for EKS throughout 2025 and 2026: OTel Container Insights for infrastructure metrics, Application Performance Monitoring for application telemetry, and Container Network Observability for the network layer. Accelerated compute insights supplies the missing layer, the accelerators themselves. Teams gain GPU and Inferentia utilization, cost waste, and device-level health, all enriched with Kubernetes metadata and connected to automated remediation, in the same place they already monitor everything else.
- OTel Container Insights for EKS (GA, June 2026) gathers infrastructure metrics from clusters using OpenTelemetry, with up to 150 descriptive labels per metric and PromQL support in CloudWatch Query Studio.
- Application Performance Monitoring enabled by default (February 2026) in the CloudWatch Observability EKS add-on delivers application-level telemetry from the start.
- Container Network Observability (November 2025) offers service maps, flow tables, and network performance metrics for EKS traffic, powered by CloudWatch Network Flow Monitor.
- Observability patterns for AI agents on Amazon EKS (October 2026) documents observability patterns for agentic AI workloads running on EKS.
Getting started today
Amazon CloudWatch accelerated compute insights is available today in all Regions where CloudWatch Omni is available. To begin:
- Install or upgrade to the latest CloudWatch Observability EKS add-on on the cluster.
- Open CloudWatch Omni to view inference workloads, with accelerator health and waste for each one.
- Troubleshoot and optimize from the workload view, from time to first token down to a single device.
Consult the documentation for additional details.