
When software infrastructure spans multiple interconnected services deployed across containers, traditional monitoring approaches fall short. Developers and operations teams struggle to understand application behavior across distributed systems, especially when container orchestration, microservices patterns, and cloud native technologies compound the debugging challenge. Comprehensive observability—which goes deeper than conventional monitoring to reveal system dynamics—offers a solution. By implementing distributed tracing frameworks such as OpenTelemetry and Jaeger within Docker environments, teams can identify performance degradation before it impacts users, strengthen system reliability, and dramatically cut the time spent resolving incidents.
Why Observability Matters More Than Ever
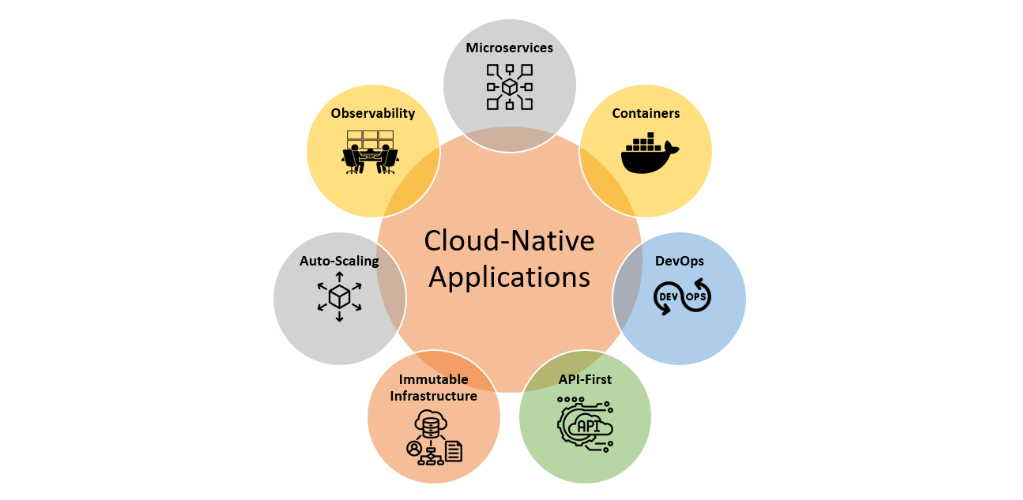
Today's applications operate as networks of interdependent services and APIs, each contributing to overall system behavior. Docker simplifies the deployment and scaling of microservices, yet this architectural approach introduces substantial complexity. Pinpointing the root cause of failures across many interconnected components becomes difficult. Detecting performance slowdowns or resource bottlenecks requires immediate visibility rather than delayed log analysis. Without comprehensive observability, troubleshooting becomes protracted and inefficient, directly increasing Mean Time To Resolution (MTTR).
In practice, teams managing large-scale container infrastructure have discovered that relying solely on log correlation and metric-driven alerts succeeds only about 70% of the time; the remainder involves guesswork and lengthy incident response meetings. Once distributed tracing enters the picture—enabling trace propagation across service boundaries—MTTR drops significantly. Debugging shifts from exhaustive log searching to following execution timelines across services.
Why Docker-Based Environments Need Observability
Container-based deployments introduce distinct observability challenges. Containers frequently start and stop, complicating traditional monitoring approaches. Resource sharing among containers can obscure performance problems. Asynchronous communication patterns between microservices make tracing difficult without proper instrumentation. A real-world example illustrates this: a containerized frontend application experienced periodic crashes. CPU and memory metrics appeared normal, logs provided little insight, and autoscaling masked the underlying issue. Only after adding trace context through OpenTelemetry and visualizing service dependencies in Jaeger did the root cause emerge—an authentication service timing out under high concurrent load. This intelligence was impossible to extract from metrics alone.
Introducing OpenTelemetry and Jaeger
OpenTelemetry
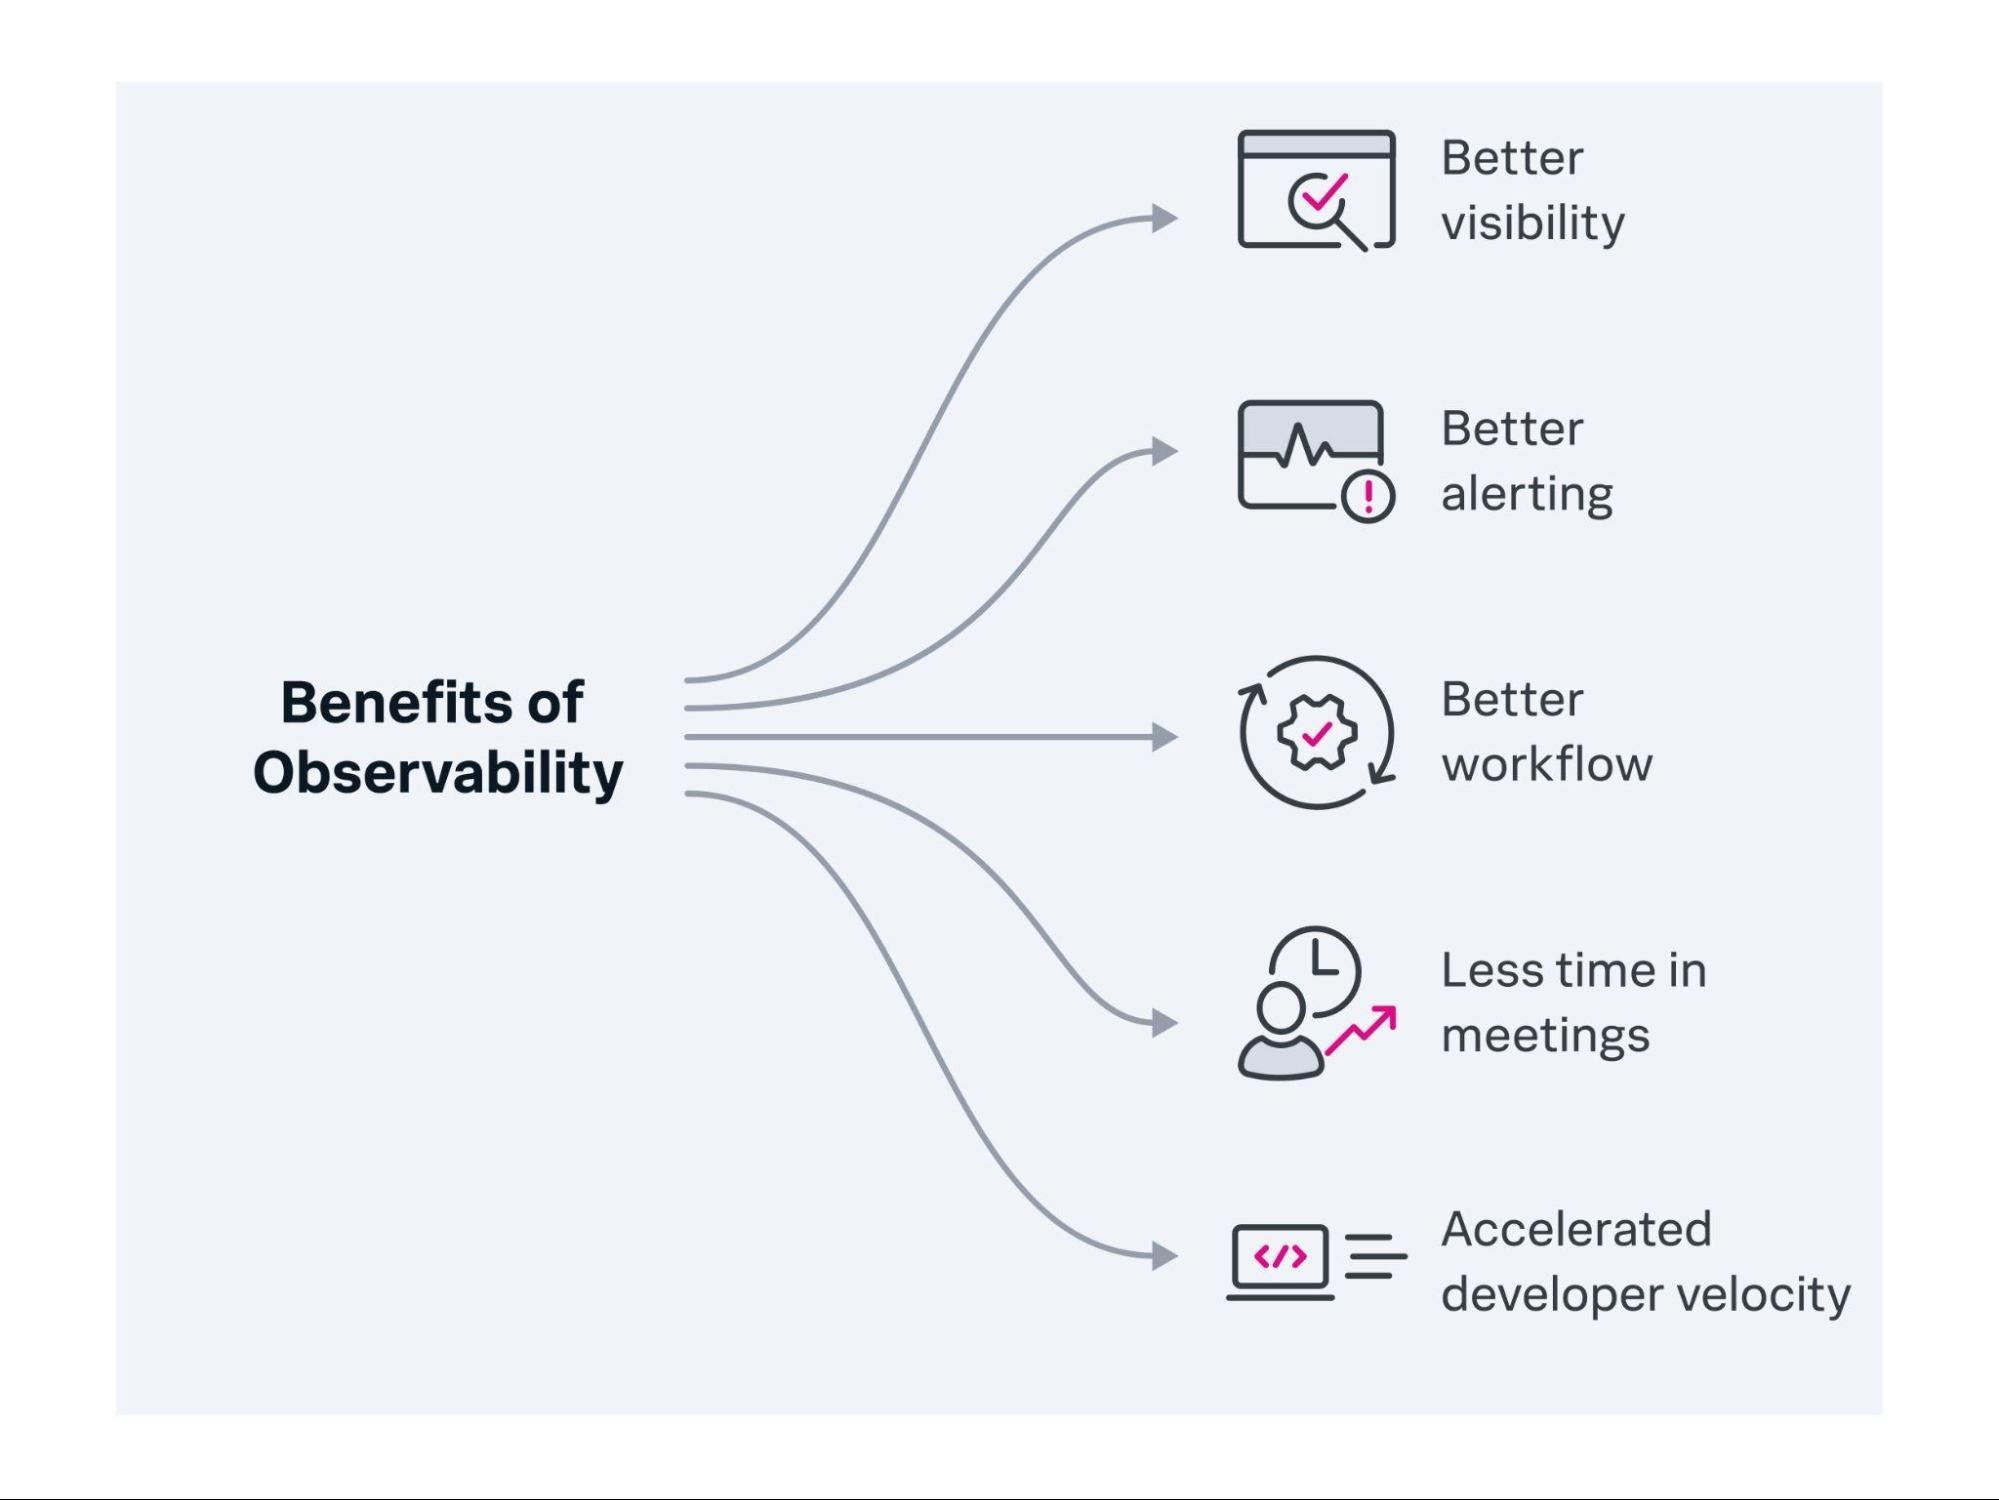
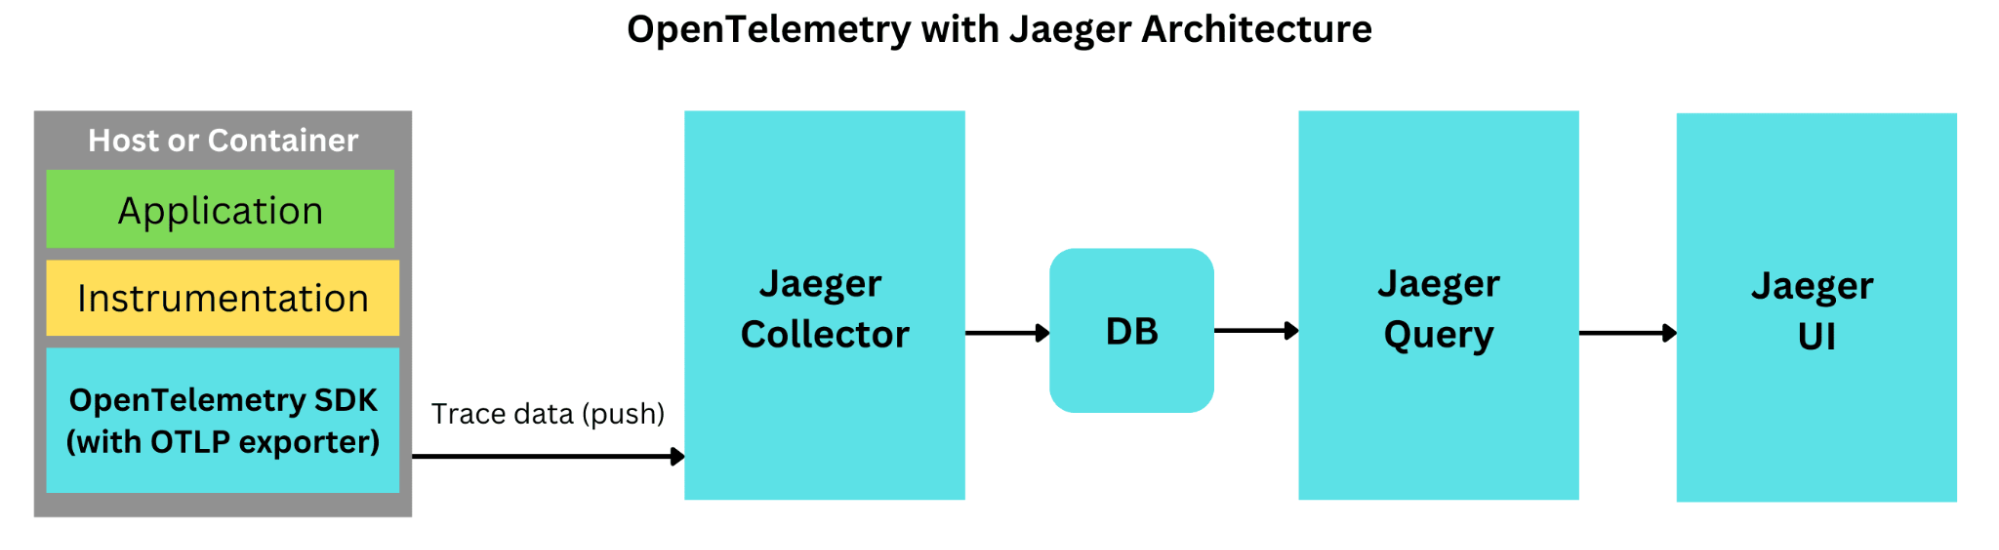
OpenTelemetry is an open CNCF standard for instrumentation, tracing, and metrics collection in cloud native applications. It enables consistent telemetry data collection across applications, simplifying observability implementation and data analysis.
Jaeger
Jaeger is an open-source distributed tracing system originally developed by Uber. It excels at visualizing and analyzing trace data from OpenTelemetry, providing intuitive dashboards that help developers quickly identify performance bottlenecks and system issues.
Alternative Solutions to Jaeger
Other tracing tools exist for specific requirements:
- Zipkin offers comparable features and maintains OpenTelemetry compliance.
- Elastic APM provides a comprehensive observability platform with native support for tracing, metrics, and logging.
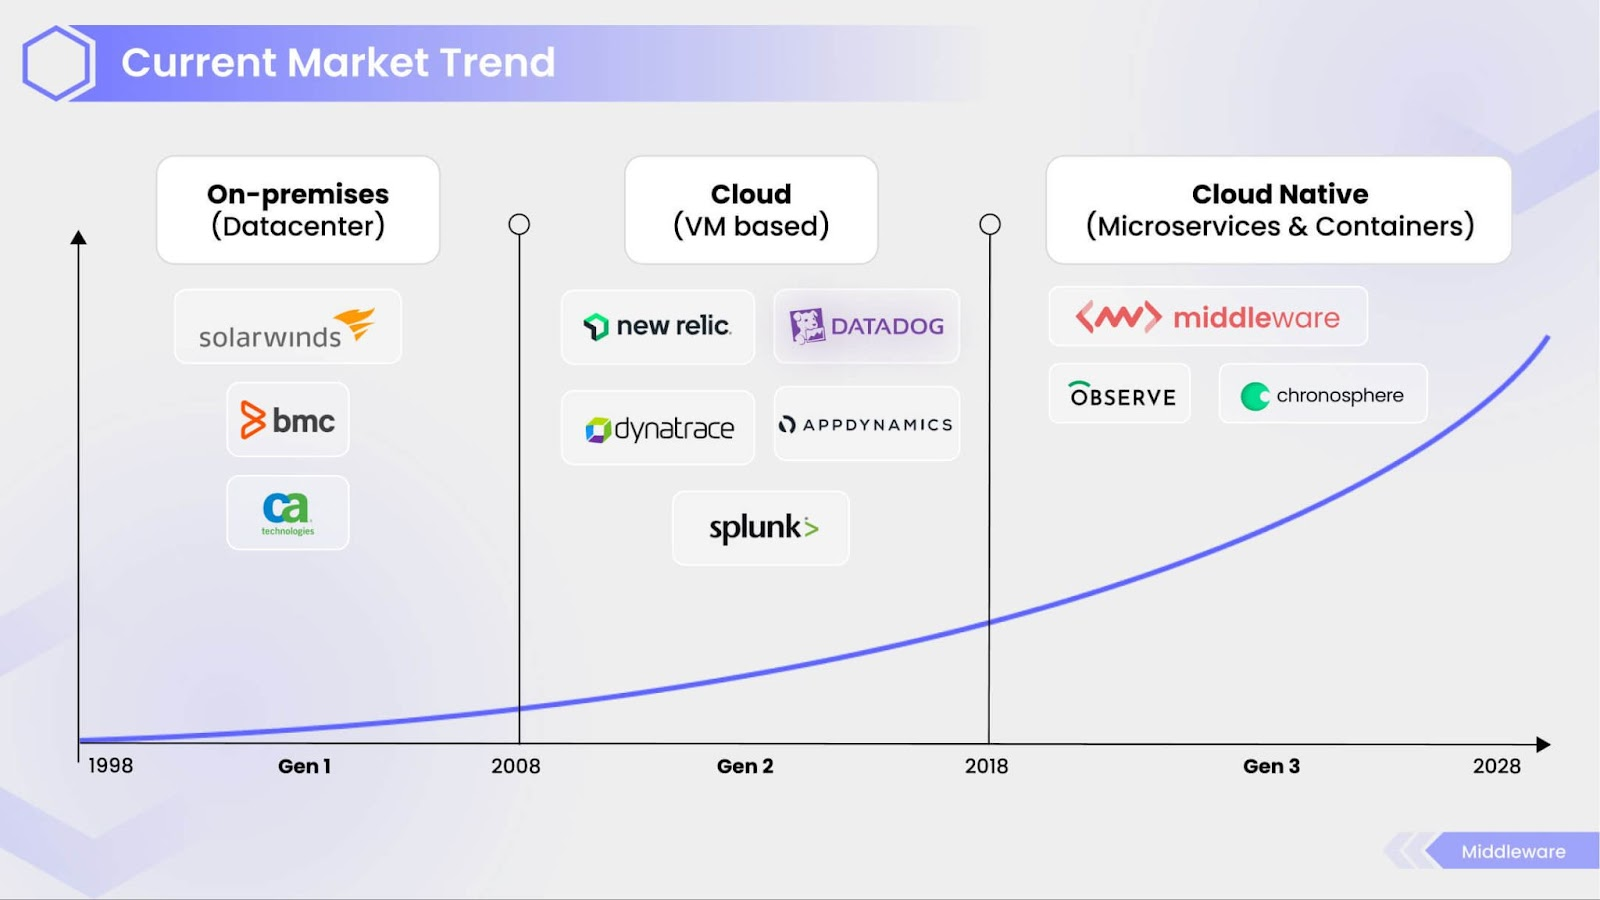
- Datadog and New Relic deliver proprietary observability solutions with extensive feature sets.
Jaeger's open source licensing and seamless Docker integration make it particularly attractive for teams seeking cost-effective and adaptable solutions.
Setting Up OpenTelemetry and Jaeger in Docker
Step 1: Instrument Your Application
Consider a Node.js microservice as an example:
// server.js
const express = require('express');
const { NodeTracerProvider } = require('@opentelemetry/sdk-node');
const { registerInstrumentations } = require('@opentelemetry/instrumentation');
const { ExpressInstrumentation } = require('@opentelemetry/instrumentation-express');
const { JaegerExporter } = require('@opentelemetry/exporter-jaeger');

const provider = new NodeTracerProvider();
provider.addSpanProcessor(
  new (require('@opentelemetry/sdk-trace-base').SimpleSpanProcessor)(
    new JaegerExporter({ endpoint: 'http://jaeger:14268/api/traces' })
  )
);

provider.register();
registerInstrumentations({ instrumentations: [new ExpressInstrumentation()] });

const app = express();
app.get('/', (req, res) => res.send('Hello World'));
app.listen(3000);
FROM node:18-alpine
WORKDIR /app
COPY package.json ./
RUN npm install
COPY . .
EXPOSE 3000
CMD ["node", "server.js"]
version: '3.8'
services:
  app:
    build: .
    ports:
      - "3000:3000"
    depends_on:
      - jaeger
  jaeger:
    image: jaegertracing/all-in-one:1.55
    ports:
      - "16686:16686"
      - "14268:14268"
Launch your environment with docker compose up. Access the Jaeger UI at http://localhost:16686 to explore tracing data.
Real Experience Implementing This at Scale
Deploying this configuration across many microservices in a high-traffic production system reveals a critical insight: observability must be built into infrastructure from the start, not added as an afterthought. When container orchestration provides scalability and traces offer visibility into system behavior, all teams—infrastructure, frontend, backend—can reference the same trace IDs to solve edge cases. This unified approach surpasses the fragmented visibility offered by disconnected logging systems.
Major technology companies including Uber, Red Hat, and Shopify rely heavily on Jaeger for real-time observability. These organizations use distributed tracing to detect microservice performance degradation quickly, enhance end-user experience by proactively identifying latency issues, and maintain high reliability through rapid incident detection and resolution.
Advanced Observability Techniques
Distributed Context Propagation
Leverage OpenTelemetry's automatic HTTP header propagation to preserve trace context as requests flow between services.
Custom Span Creation
Manually define spans to gain deeper understanding of complex functions:
const axios = require('axios');
app.get('/fetch', async (req, res) => {
  const result = await axios.get('http://service-b/api');
  res.send(result.data);
});
const { trace } = require('@opentelemetry/api');
app.get('/compute', (req, res) => {
  const span = trace.getTracer('compute-task').startSpan('heavy-computation');
  // Compute-intensive task
  span.end();
  res.send('Done');
});
Integrating Observability into CI/CD Pipelines
Embed observability checks into continuous integration and deployment workflows, such as GitHub Actions, to verify that code changes maintain visibility standards:
name: CI Observability Check
on: [push]
jobs:
  check:
    runs-on: ubuntu-latest
    steps:
      - uses: actions/checkout@v2
      - name: Run Docker Compose
        run: docker compose up -d
      - name: Observability Verification
        run: curl --retry 5 --retry-delay 10 --retry-connrefused http://localhost:16686
The Future of Observability
Observability continues advancing rapidly, particularly with AI-driven analytics and predictive monitoring. Emerging capabilities include automated anomaly detection, AI-assisted root cause analysis, and improved predictive alerting that enables early incident prevention. OpenTelemetry and Jaeger position organizations to leverage these advancements in future deployments.
As teams increasingly deploy AI and machine learning services, observability must evolve accordingly. Experience integrating large language model services into container pipelines demonstrates how opaque model behavior becomes without proper instrumentation. OpenTelemetry and related technologies are beginning to address this gap, making it possible to track inference latency, resource consumption, and system interactions on a unified timeline—a capability that will prove essential in AI-native environments.
Conclusion
Combining OpenTelemetry and Jaeger substantially improves observability in Docker environments, enabling teams to monitor and govern distributed systems more effectively. These integrated technologies deliver real-time, actionable intelligence that accelerates troubleshooting, enhances performance, and sustains high availability. As containerization and microservices adoption accelerates across organizations, mastering observability best practices has become essential for operational success.
Source: The New Stack