
Cloudflare announced in August that it had become the fastest content delivery provider across 74% of the world's 1,000 largest networks, a 14-percentage-point jump from April's Agents Week update. The company attributes the improvement partly to expanded measurement techniques and partly to infrastructure gains. Response time matters: milliseconds of latency directly influence how quickly end users access applications, APIs, and websites.
Fastest provider in 74% of top networks
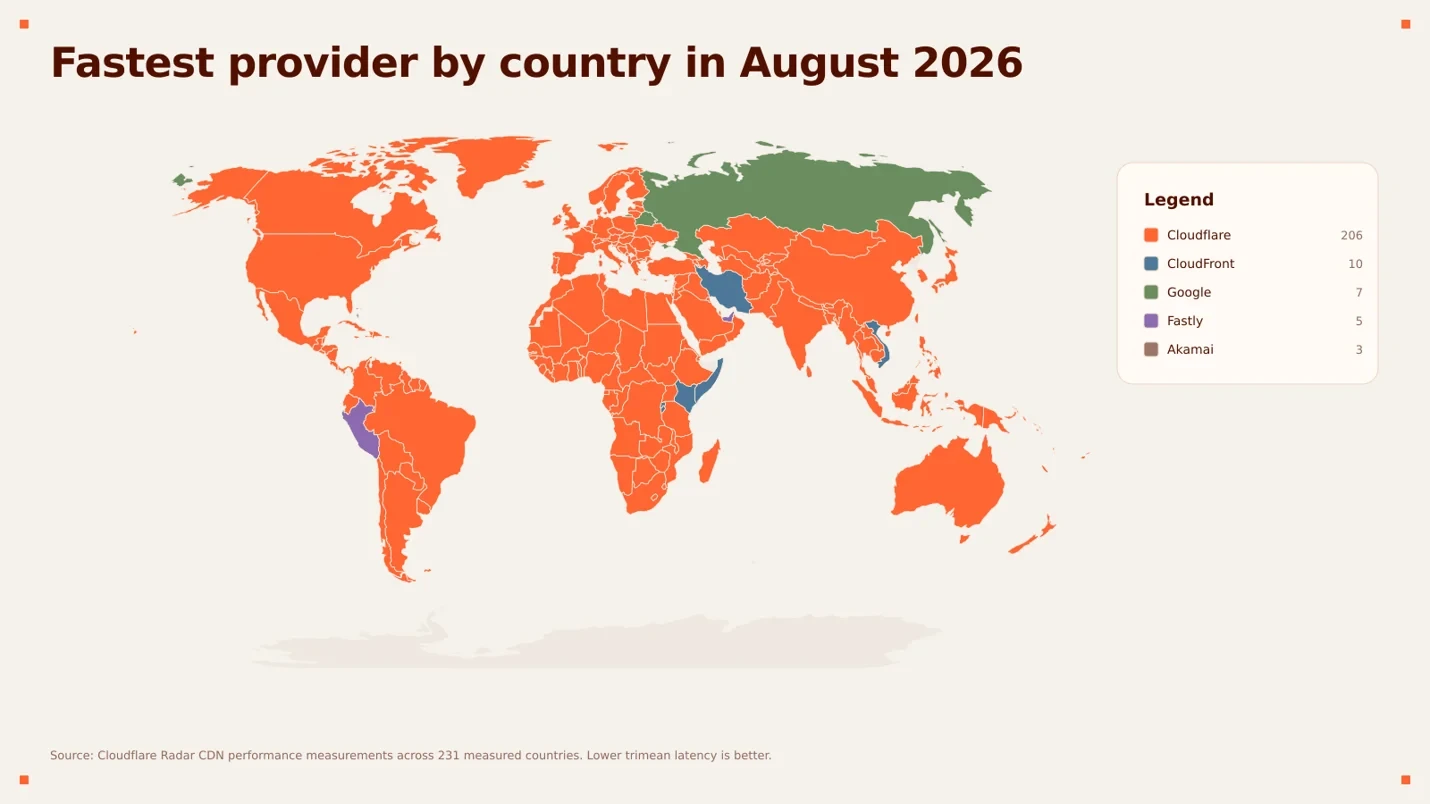
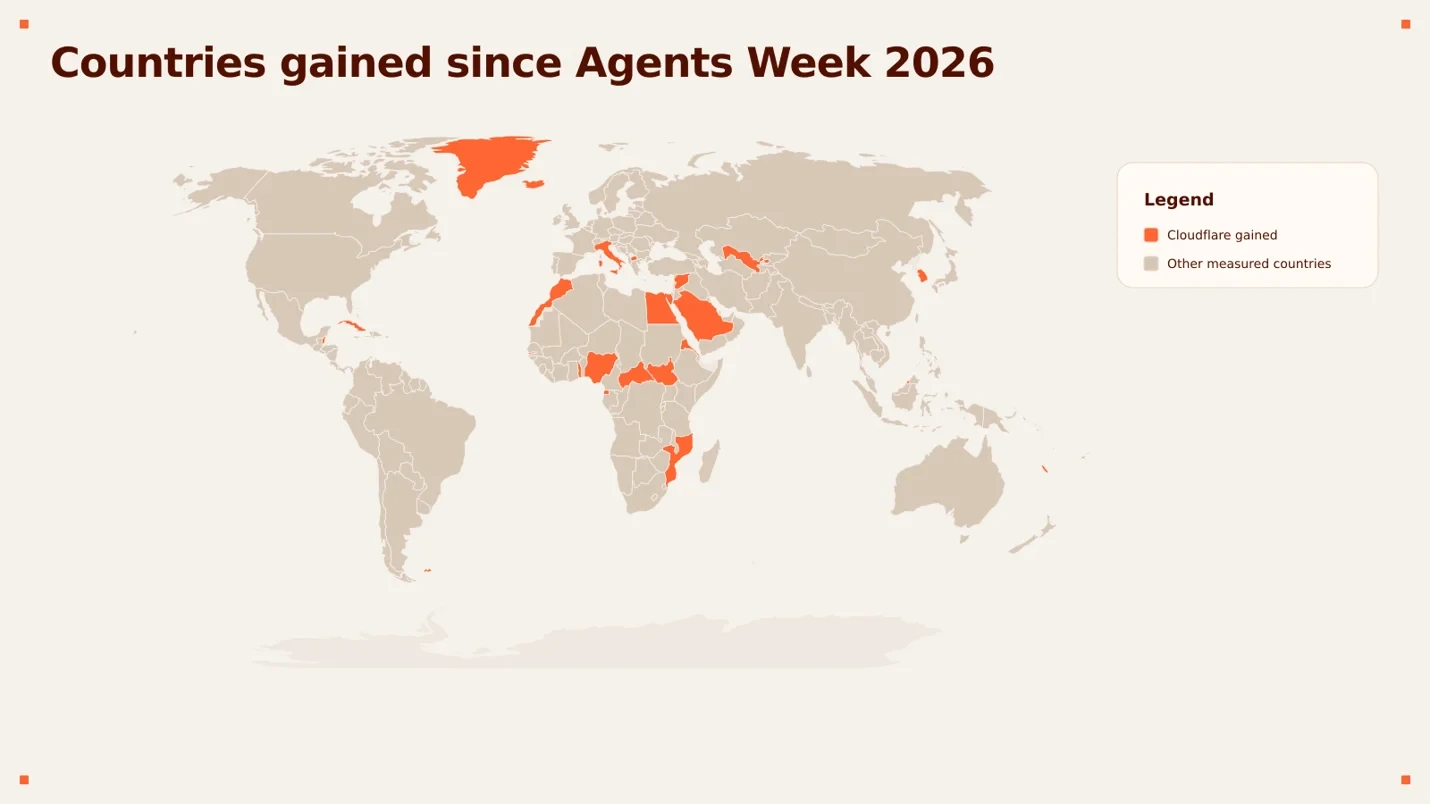
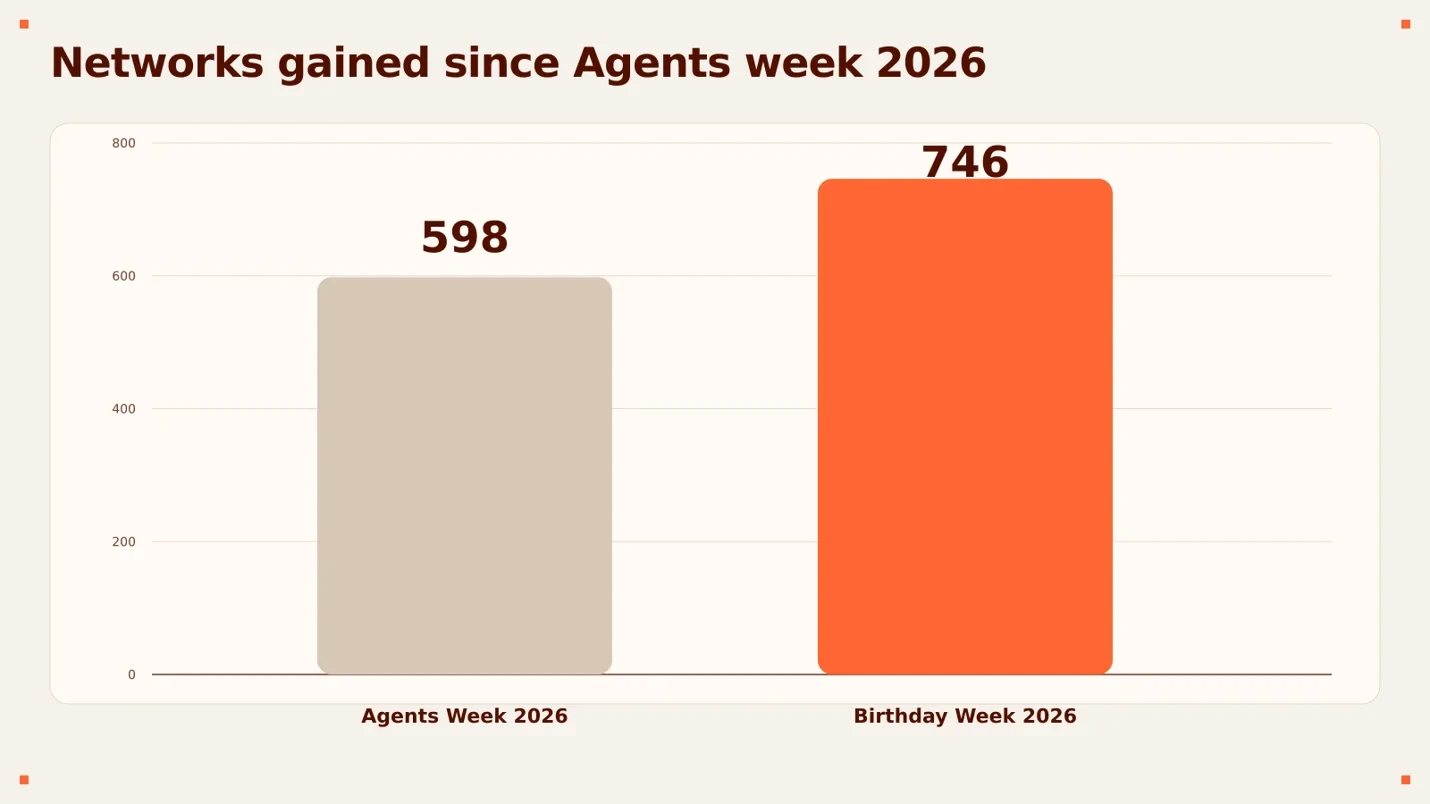
The August results show Cloudflare holding the fastest-provider ranking across 74% of the top 1,000 networks, up from 60% in April. This represents an additional 150 networks where Cloudflare now ranks first, and 38 additional countries where it claims the fastest-provider position. The company measures this by identifying the fastest provider for users on the networks that serve the largest user populations in each country.
How measurements are conducted
Cloudflare's analysis focuses on the 1,000 largest networks globally, ranked by estimated user population using APNIC data. These networks span diverse geographies and access environments, offering insight into actual Internet experience across the world.
Performance evaluation relies on connection time—the duration required for a user's device to complete a TCP handshake when requesting content. This metric reflects real-world conditions including distance, routing, and congestion, while remaining precise enough to compare providers and identify improvement opportunities.
To rank providers, Cloudflare calculates the trimean of connection times, combining the 25th percentile, 50th percentile, and 75th percentile into a weighted average. This approach reduces the influence of outliers while representing the range of experiences most users encounter.
When users encounter Cloudflare-branded error pages, their browsers run a small background measurement that fetches lightweight files from several providers: Cloudflare, Amazon CloudFront, Google, Fastly, and Akamai. The system records connection duration from each user's browser, on their network, in real time. Since 2021, these error pages have supplied reliable real-user performance data, though Cloudflare has now expanded collection through an additional channel.
Introducing Challenge Pages for performance benchmarking
Cloudflare Challenge Pages are full-page verification screens that evaluate visitors before they reach a website. When triggered—typically by a Web Application Firewall rule—the Challenge Page gates the request, evaluates the browser environment for automated signals, and permits legitimate visitors through, usually without requiring interaction. Challenge Pages are powered by Cloudflare Turnstile, a privacy-preserving, risk-based challenge technology that executes directly in the visitor's browser.
How it works
From the end user's perspective, Challenge Page-based measurement operates similarly to existing error-page measurements: it runs silently in the browser and requires no additional user action. While a visitor is on a Challenge Page, a small non-interactive measurement runs in the background, fetching lightweight files from fixed endpoints including Cloudflare, Amazon CloudFront, Google, Fastly, and Akamai, and recording completion status and duration for each request.
Cloudflare designed the Challenge Page measurement to avoid adding noticeable latency while preserving the privacy-focused properties that distinguish Turnstile from traditional CAPTCHAs. Currently, measurements run on only a small fraction of eligible free Challenge Pages alongside continued error-page data collection. The company will limit measurements to free Challenge Pages and increase sampling only if additional data improves measurement quality and end-user performance remains unaffected.
Challenge Pages' reach enhances measurement scale
The primary advantage over error-page measurement alone is reach. Cloudflare-branded error pages provided high-quality measurements from a narrower set of use cases, while Challenge Pages enable similar measurements during routine interactions wherever a challenge is already deployed. This yields more measurements from more networks without requiring users to take additional steps. The company reports that Challenge Page measurement dramatically increases data volume and expands the diversity of users, networks, and geographies captured.
More measurement, more possibilities
Although initial Challenge Pages results are promising, Cloudflare envisions further improvements. First, the company aims to describe user experience across as many networks as possible. Because Challenge Pages operate across a broad set of websites and visitors, they capture measurements from networks beyond the top 1,000 and provide far more samples within each one, especially as test volume increases. This breadth enables new analytical approaches: weighting performance by user count rather than network count, grouping results by country or worldwide scope, and quantifying what share of total user traffic the measured networks represent.
Second, increased measurement volume sharpens resolution in close races. In many networks, top providers are separated by only one or two milliseconds of trimean connection time—for instance, Cloudflare at 50 ms and Fastly at 51 ms—a gap small enough that ordinary daily variation can shift rankings. As Challenge Pages add measurement volume, the confidence interval around each provider's trimean narrows, distinguishing genuine leads from statistical noise. Current results are preliminary; as the dataset grows, future ranking movements should increasingly reflect real performance changes.
Improved measurements show Cloudflare as #1
The significant improvement coincides with the new measurement methodology. Increased measurement volume gives Cloudflare more opportunities to compare performance against other top providers across a broader set of networks and user conditions, yielding clearer signals in networks where performance among leaders is very close.
For example, Cloudflare may have previously ranked second in some networks despite having a trimean connection time only 1 or 2 ms slower than the fastest provider. With more measurements, results become less sensitive to outliers and day-to-day variation, making rankings more stable, particularly in countries and networks where the fastest provider previously changed frequently. As the dataset becomes larger and more representative, a more consistent picture of which provider is actually fastest in each network emerges.
Performance is a continuous process
Improving performance and improving how it is measured are both ongoing efforts. This year's results demonstrate meaningful progress: Cloudflare ranks as the fastest provider in 74% of the top networks it measures, and the new Challenge Pages-based methodology provides a broader, more stable view of Internet performance worldwide. Cloudflare says it will continue using this data to identify where it can improve speed, validate the impact of its changes, and enhance the Internet for customers and users who depend on the platform.