
Determining the source of unexpected resource consumption in applications remains a persistent challenge for development teams. While logs and aggregate metrics provide some visibility, they often lack the granularity needed to pinpoint exactly where CPU cycles are being spent or memory is being allocated. Profiling offers a more direct path to understanding application behavior at the function level.
Cloudflare has announced the availability of CPU and memory profiling for Workers and Durable Objects. The feature, accessible from the Workers Observability page, enables developers to request on-demand profiles of active Workers, visualize results as interactive flamegraphs, and export profile files for deeper investigation.
Profiling in production environments provides insights that local testing cannot replicate. Real-world traffic patterns and scale expose performance characteristics that remain hidden in development settings.
Getting started with profiling
Developers can initiate profiling through either the command-line interface or the Cloudflare Dashboard. The CLI approach requires the cf package and uses a straightforward command structure:
cf workers versions profile latest \
     --worker-id "$WORKER_ID_OR_NAME" \
     --duration-ms 5000 \
     --profile-type cpu > worker-cpu.pprof
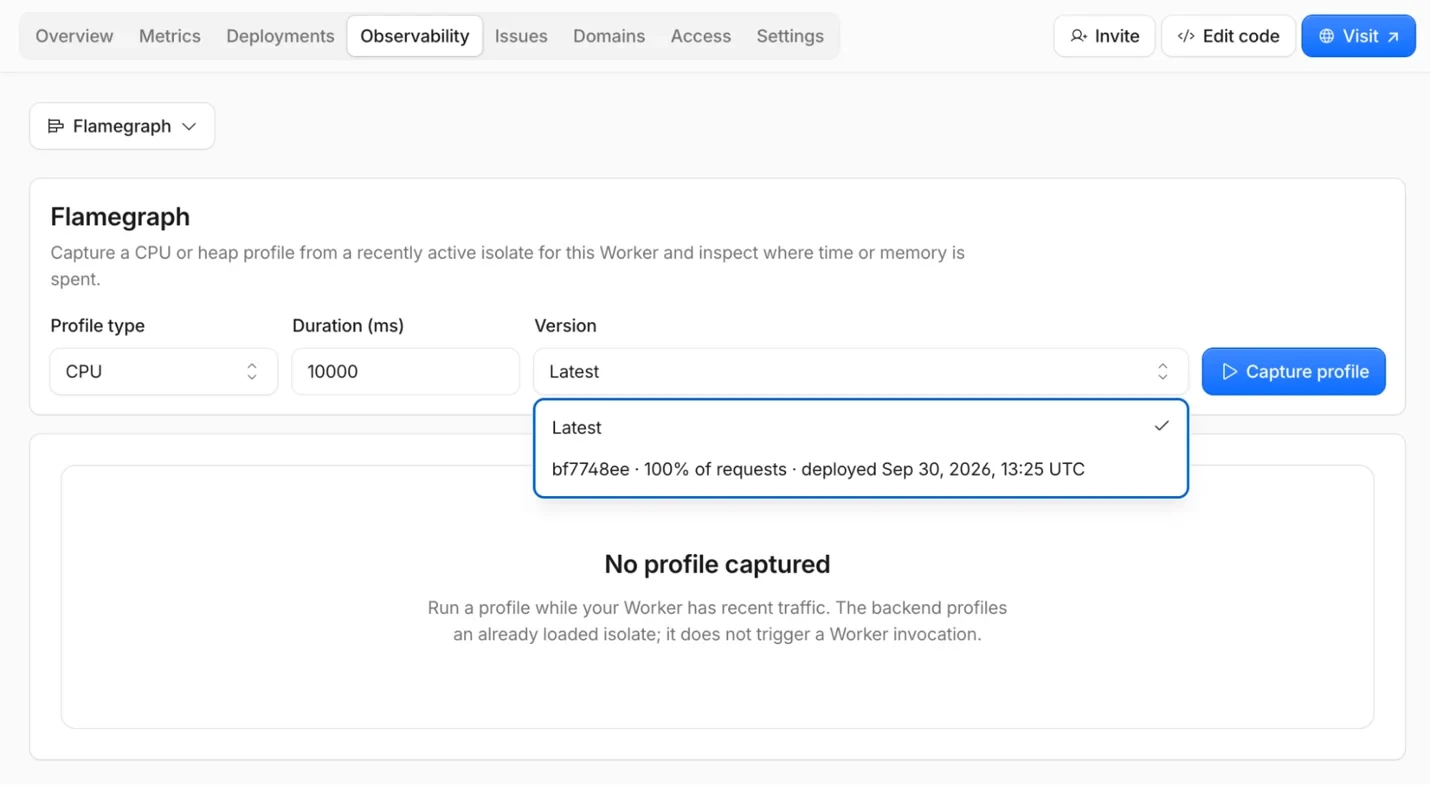
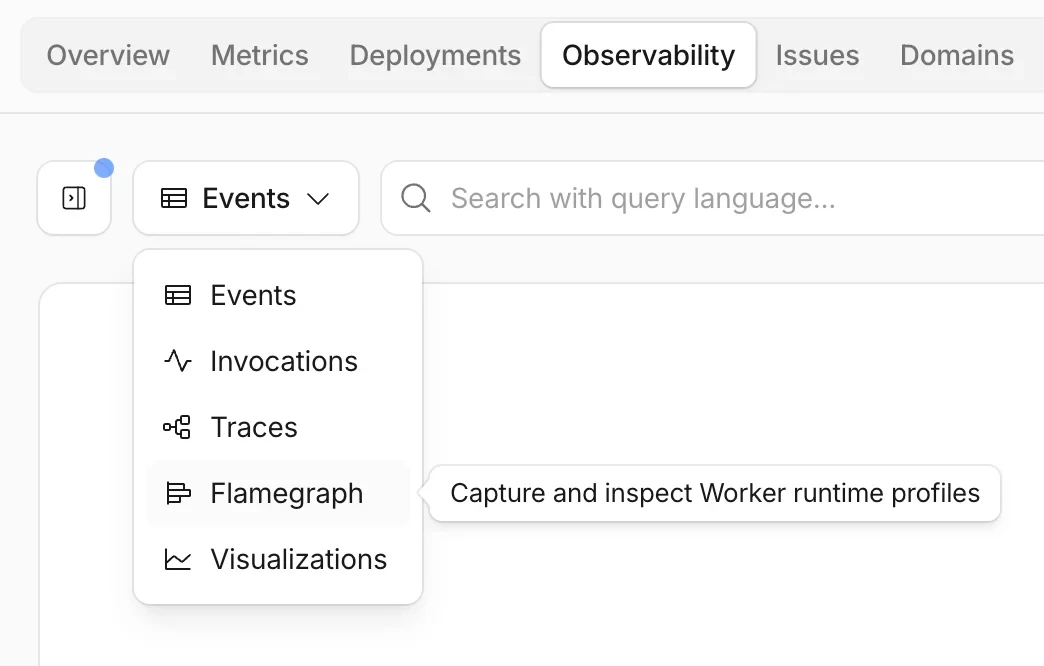
Dashboard access follows a navigation path through Build → Compute → Workers & Pages, where users can select a Worker and access its Observability tab. From there, the Flamegraph option becomes available for capturing profiles.
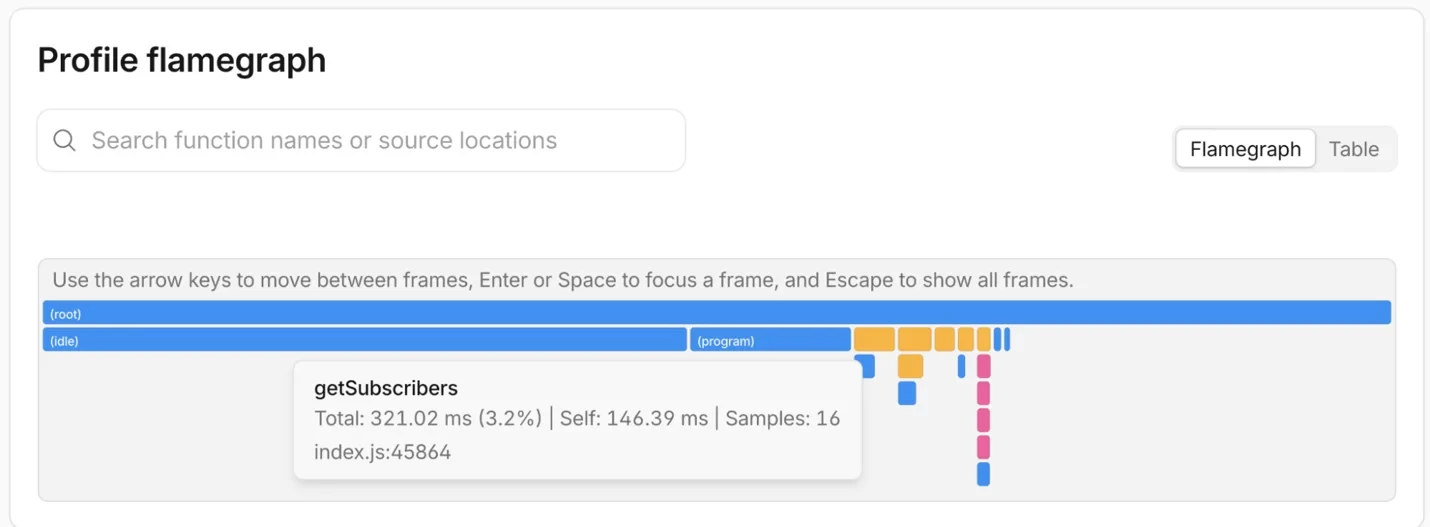
The profiling interface allows selection of profile duration and Worker version. Sufficient traffic is necessary for meaningful results, so selecting a version receiving adequate request volume is critical. After initiating capture, the profiler runs for the specified duration and renders results as a flamegraph, where rectangle width indicates CPU time or memory consumption. Developers can interact with individual functions to examine details and identify the widest (most resource-intensive) functions.
For TypeScript-based Workers, enabling source maps ensures that profiling output displays readable function names rather than obfuscated identifiers.
Production optimization examples
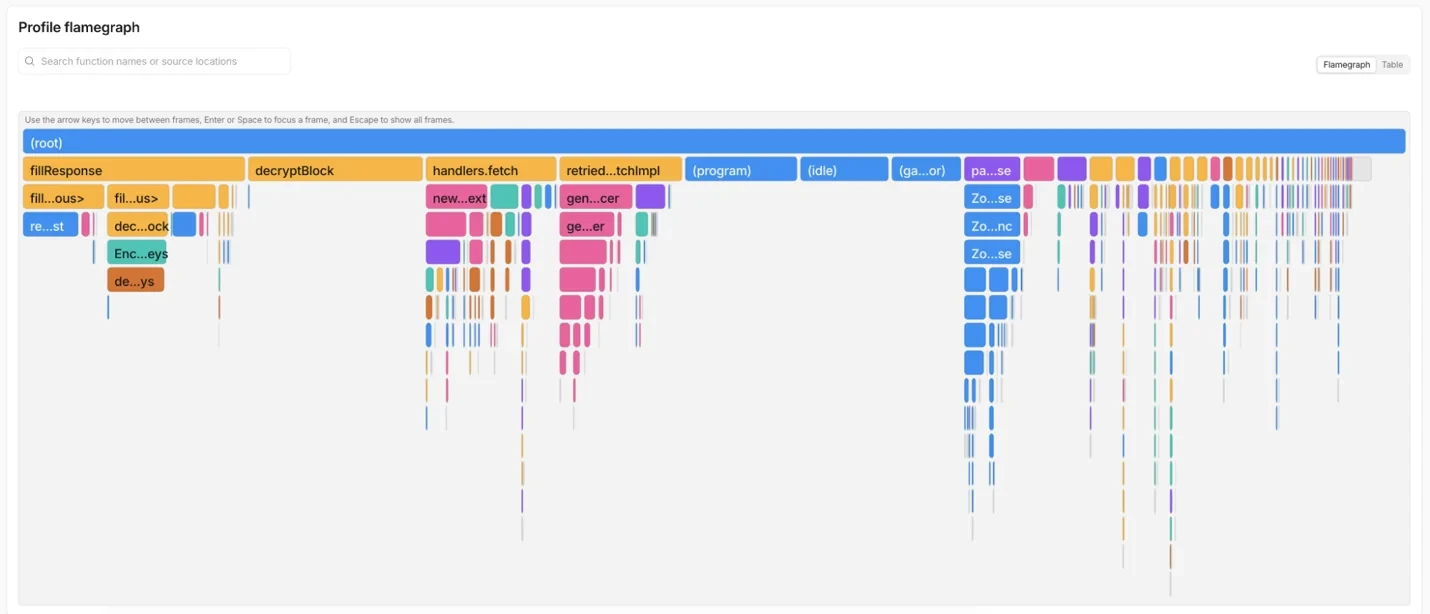
Cloudflare teams have already leveraged CPU and memory profiling to optimize memory and CPU usage, resolve out-of-memory errors, and enhance performance across multiple deployments.
CPU profiling for performance gains
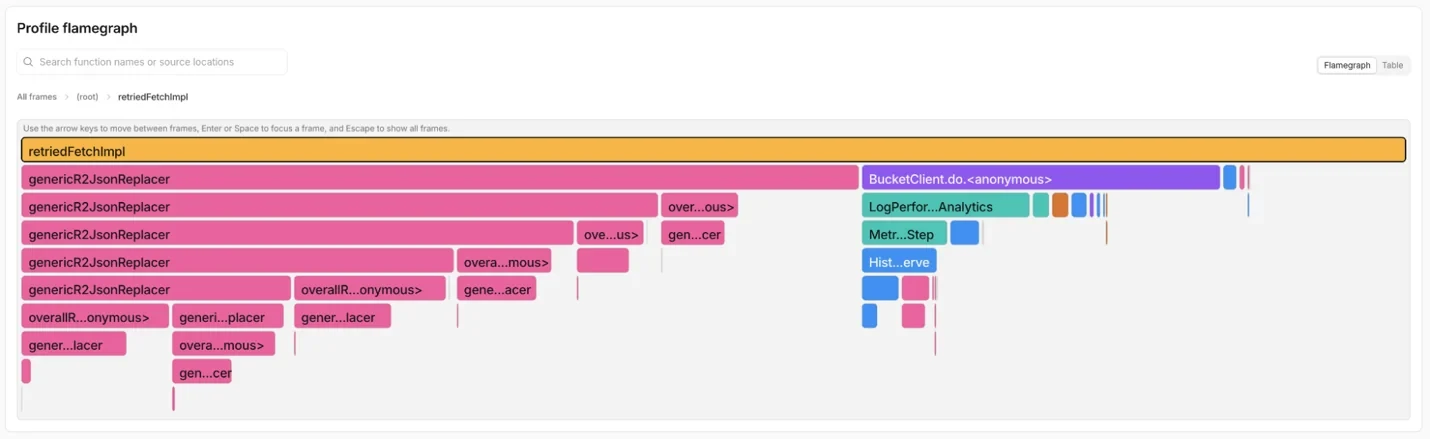
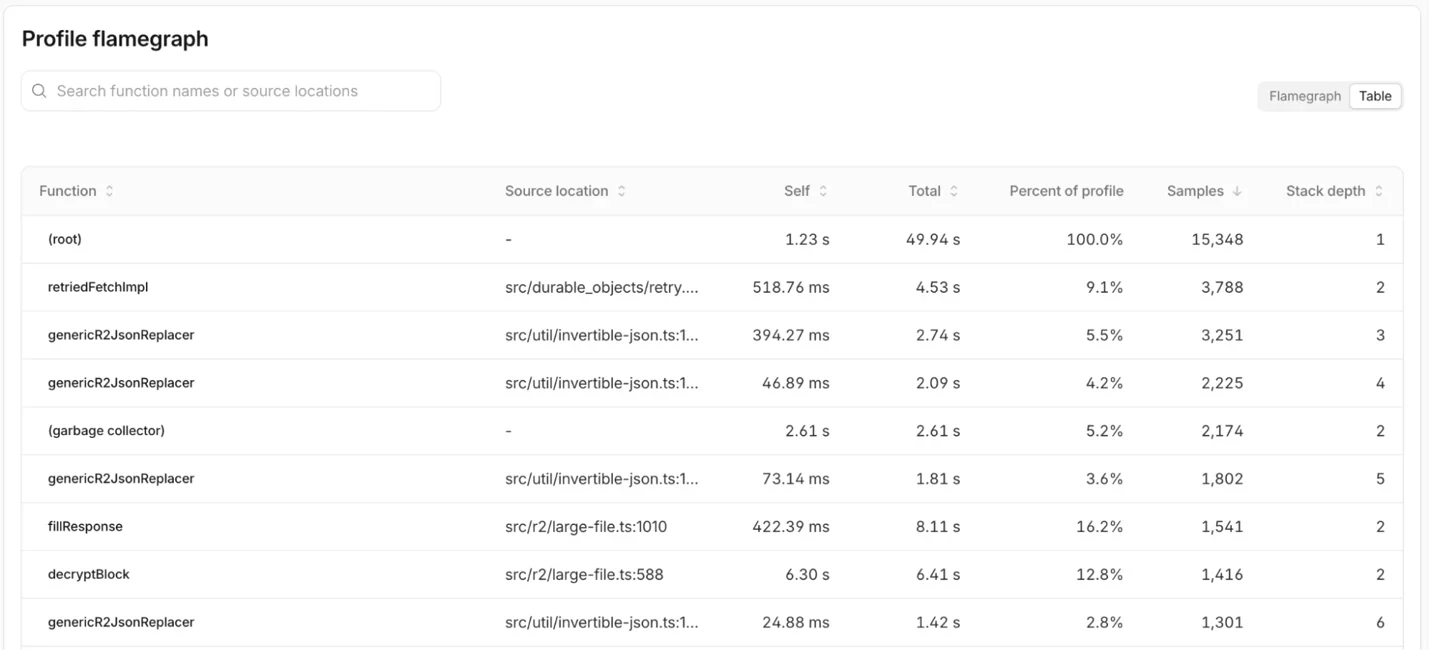
A real-world case involved profiling the Worker implementing R2 bindings over a 50-second window. While some CPU-intensive operations like decryptBlock and fillResponse lacked obvious optimization paths, the table view revealed genericR2JsonReplacer consuming over 5% of CPU time. Investigation showed the function was walking the JSON tree recursively while also being called by JSON.stringify on each node, causing deeply nested values to be processed multiple times. Eliminating this redundant work improved the function's speed by 2.7x.
A second optimization involved a duplicate call to metrics. The function was being invoked twice—once to check if data existed and again to return results—with each call representing 1% of CPU time. Caching the result of the first call eliminated unnecessary overhead.
Memory profiling for stability
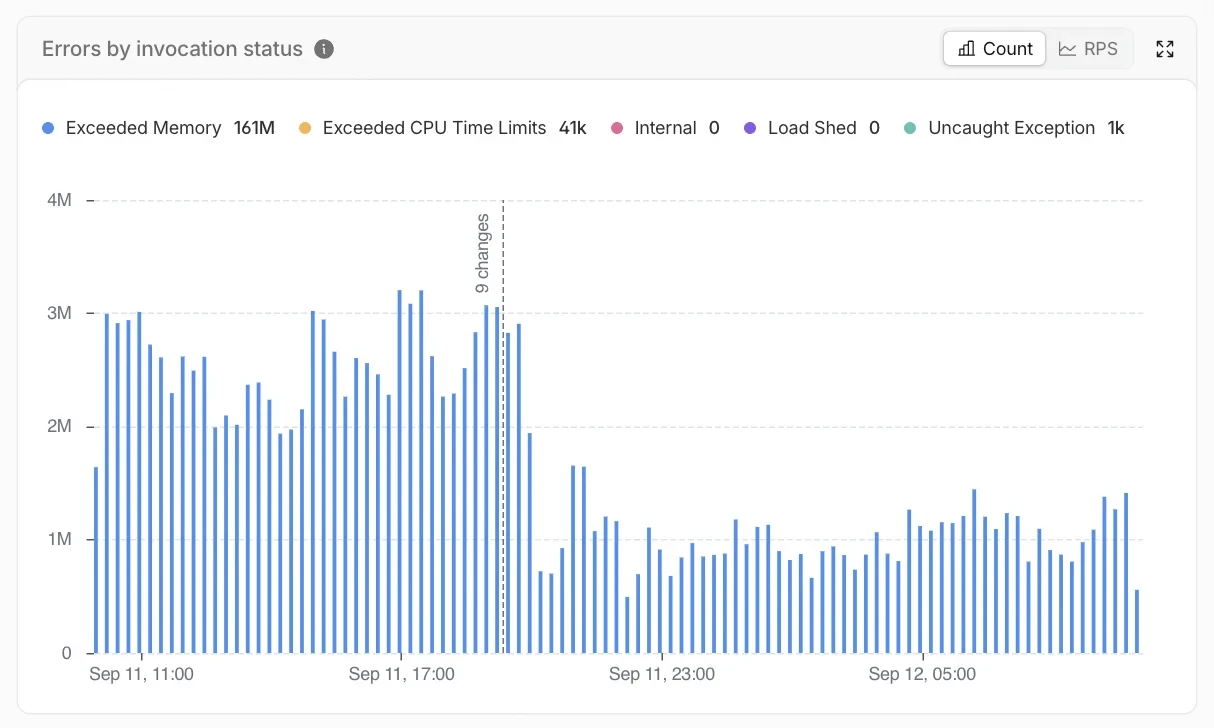
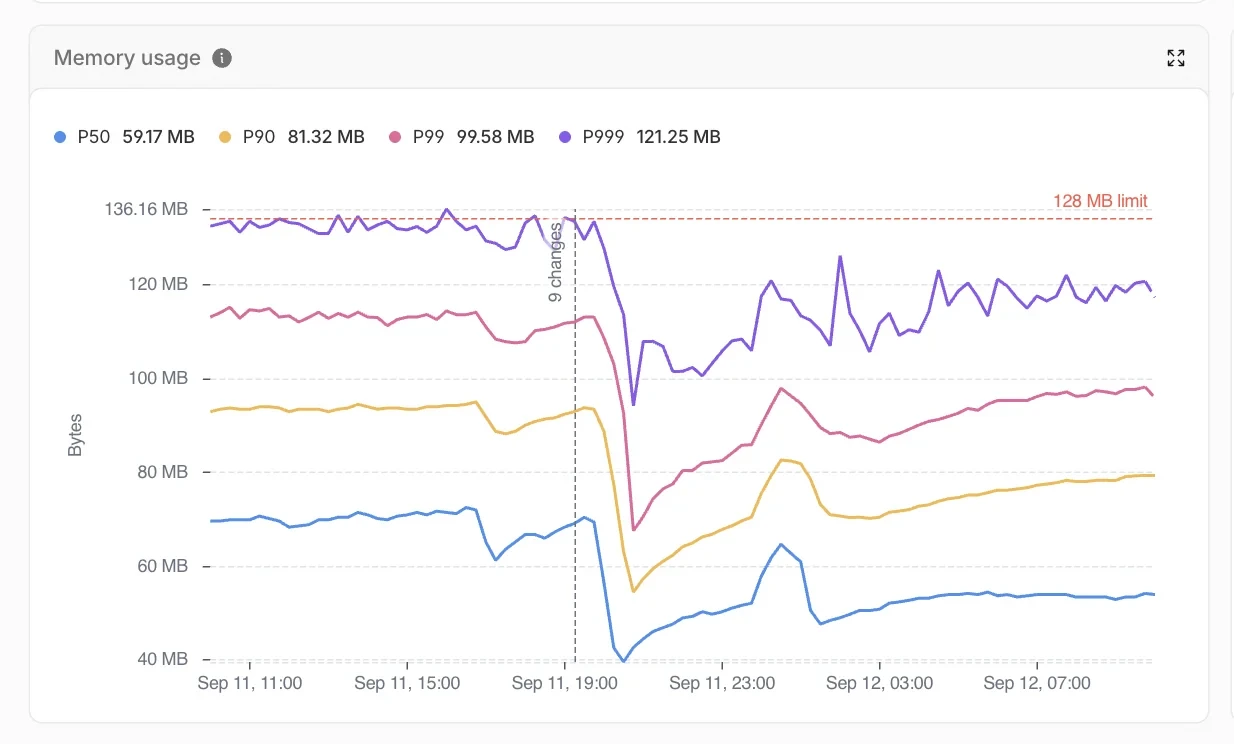
An internal Worker exhibited memory pressure, with P999 memory usage hovering near 133 MB against the 128 MB limit, triggering frequent "Exceeded Memory" evictions. Heap profiling revealed that Prometheus instrumentation code accounted for approximately 66.7% of allocations. Although the code was believed to be disabled, enough of it remained active to consume memory despite never exporting collected data. Completely removing the Prometheus code path recovered approximately 10 MB of headroom below the memory ceiling.
Technical architecture
Routing profiling requests to the edge
Workers have long supported local profiling through Chrome DevTools, but production profiling was previously unavailable. The distributed nature of Workers—replicated across data centers and physical servers based on client proximity—introduces complexity. Durable Objects add further layers through dynamic placement and mobility.
Before initiating a profiling session, the system must resolve several questions:
- Which version should be profiled?
- In which data center has that version recently executed?
- Is the Worker's isolate still loaded in that data center?
- Does the isolate belong exclusively to the requesting account?
- For a Durable Object, where is the exact live primary actor?
The client initiating the profiling request—typically the dashboard or a custom API call—provides answers to these questions. An example API request specifies both the script name and version in the URL:
curl 'https://api.cloudflare.com/client/v4/accounts//workers/workers//versions/latest/profile' \
  --data-raw '{"duration_ms":5000,"profile_type":"cpu"}'
The system does not spawn new isolates for profiling, as the goal is observing genuine production execution. This means Workers receiving minimal traffic may be difficult to profile, making version selection important.
Non-blocking profiler operation
Profiling only yields useful data when the application continues executing during sample collection. The Workers Runtime minimizes lock contention by holding the isolate lock only during profiler lifecycle operations. For CPU profiling, the sequence follows this pattern:
- Acquire the isolate and its lock.
- Create a V8 CPU profiler and begin sampling at a one millisecond interval.
- Release the lock to allow normal requests to proceed.
- Wait for the requested duration.
- Reacquire the lock and stop profiling.
- Release the lock and serialize results outside the critical section.
Holding the lock throughout profiling would block JavaScript execution, rendering the profile meaningless.
Durable Objects profiling
Unlike stateless Workers where any running isolate can be profiled, Durable Objects maintain state and identity. This distinction enables profiling of specific named objects anywhere globally. When profiling a Durable Object, developers specify the object by name, and the runtime routes the profiling request to the metal hosting that specific actor, delivering a profile of the exact isolate running that object.
Future directions
On-demand profiling represents an initial step in production observability, but carries inherent limitations. Developers must explicitly initiate profiling sessions, which can result in missing critical periods when Workers misbehave. Memory profiling captures only allocations occurring during the profiling window, potentially missing startup-phase allocation spikes.
To address these constraints, Cloudflare is developing continuous profiling. This approach would automatically capture profiling samples for Workers, allowing developers to explore profiles through the dashboard without manual initiation. This capability should simplify the capture of rare or infrequent events.